The goal of streamsampler is to provide the ability to
perform periodic and/or stratified subsampling of a water quality record
of daily (or at least very frequent) observations. The water quality
record can be subsampled based on a set frequency, such as the 15th of
each month; or the record can be subsampled using a stratified approach
based on a seasonal threshold of reference measurements, such as
discharge, where observations occurring below and above the threshold
are subsampled according to different parameters. For example,
observations associated with a reference measurement below the
threshold, subsampling is conducted at a specified frequency (e.g.,
monthly). Observations associated with a reference measurement exceeding
the threshold are subsampled for each year of the record. Either method
results in a subsampled record that reasonably approximates a water
quality record that would have been produced by physical data
collection.
A subsampled water quality record allows a user to apply
mathematical, statistical, and/or modeling techniques to a record with
less frequent observations. For example, a user may find a 30-year
record of daily water quality observations, subsample the record, fit a
WRTDS model (from the EGRET package), and then compare the
results to the complete record. A user may also implement
streamsampler in their methods for conducting train/test or
cross-validation splits in machine learning modeling.
The streamsampler package can also determine the completeness of a discharge or water quality record, determine the location of gaps in the record, and provide the number and proportion of positive and negative values.
Install the released version from CRAN:
install.packages("streamsampler")Or install the development version from GitHub:
# install.packages("remotes")
remotes::install_github(
  repo = "Kyle-Hurley/streamsampler"
)There are two subsampling methods provided, one that is psuedo-random and one that is strictly routine. Together, these functions are intended to subsample a (near) daily water quality record such that the output resembles water quality sampling strategies described in Lee et al., 2016 and Lee et al., 2019.
The subsample() function is psuedo-random across time in
that values are selected randomly in rolling chunks of time according to
a defined frequency. If, for example, the frequency is weekly and the
number of desired observations to be selected is 1, then the result will
be 1 randomly selected observation for each week in the record.
This subsampling method is also stratified by a seasonal reference threshold. Seasons and the threshold quantile are defined by the user. Observations with values occurring on dates at or below the associated seasonally adjusted reference threshold quantile are subsampled according to the desired number of samples and by the desired frequency. A user-defined number of observations with values exceeding the seasonally adjusted reference threshold are selected at random across an entire year. Control is given to the user over randomly selecting these “exceeds threshold” values by arguments that change weights and/or target local maxima.
Most simply, subsample() allows a user to e.g. define
the seasonal threshold as the 80%’ile of discharge, randomly select 1
water quality sample per month where discharge is lower than the
discharge threshold, and randomly select 8 water quality samples per
year where discharge is higher than the discharge threshold.
The subsample_routine() function provides a method to
select observations at a regular frequency. These frequencies include
days, day of the week, and months. A user may subsample a provided water
quality record at a specified interval of days (e.g. every 10 days), on
a specified day of the week (e.g. every Tuesday), or on a day of the
month (e.g. 15th of every month).
This is a basic example which shows you how to examine the completeness of a record. Both the Specific Conductivity (SC) record and discharge (q) record in this example start in October of 2007.
library(streamsampler)

sc_dates <- streamdat[!is.na(streamdat$sc), "date"]
eval_dates(
  dates = sc_dates,
  rec_start = as.Date("2007-10-01"),
  rec_end = as.Date("2023-09-30"),
  by = "day"
)
#>   pct_complete n_miss
#> 1     98.68241     77
You can also examine a record for gaps. In this example, the first 6 gaps in the SC record are shown.
sc_gaps <- find_gaps(dates = sc_dates)
head(sc_gaps)
#>   n_days      start        end location
#> 1      9 2020-08-05 2020-08-13     4626
#> 2      5 2017-11-23 2017-11-27     3658
#> 3      4 2017-12-08 2017-12-11     3668
#> 4      3 2008-10-11 2008-10-13      377
#> 5      3 2019-07-22 2019-07-24     4255
#> 6      2 2012-07-31 2012-08-01     1746
With a few lines of code, any gap can be viewed in the parent record.
gap_start <- which(
  streamdat$date == sc_gaps[1, "start"]
)
gap_end <- which(
  streamdat$date == sc_gaps[1, "end"]
)
streamdat[(gap_start - 1):(gap_end + 1), ]
#>            date    q  sc
#> 4692 2020-08-04 4010 216
#> 4693 2020-08-05 6920  NA
#> 4694 2020-08-06  813  NA
#> 4695 2020-08-07 1840  NA
#> 4696 2020-08-08 2020  NA
#> 4697 2020-08-09  765  NA
#> 4698 2020-08-10  654  NA
#> 4699 2020-08-11  547  NA
#> 4700 2020-08-12  616  NA
#> 4701 2020-08-13  736  NA
#> 4702 2020-08-14  490 276
There are several other useful functions offered by
streamsampler, but the main functions are
subsample() and subsample_routine().
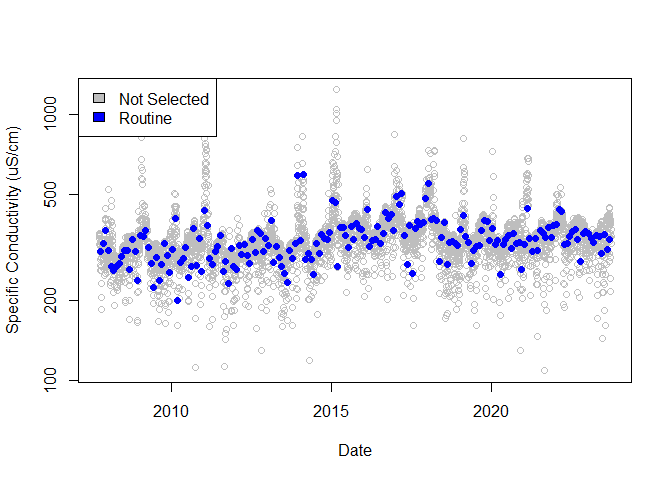
To create a subsampled water quality record composed of observations
at a specified frequency, use subsample_routine(). For
example, subsample a daily water quality record to a monthly record.
sroutine <- subsample_routine(
  dates = streamdat$date, values = streamdat$sc,
  day = 15, freq = "month"
)
df <- merge(streamdat[, -3], sroutine)

plot(
  df[df$selection_type == "not_selected", "date"],
  df[df$selection_type == "not_selected", "value"],
  col = "gray", log = "y",
  xlab = "Date",
  ylab = "Specific Conductivity (uS/cm)"
)
points(
  df[df$selection_type == "routine", "date"],
  df[df$selection_type == "routine", "value"],
  col = "blue", pch = 16
)
legend("topleft",
  c("Not Selected", "Routine"),
  fill = c("gray", "blue")
)
plot(
  df$q[df$selection_type == "not_selected"],
  df$value[df$selection_type == "not_selected"],
  pch = 21, col = "gray",
  xlab = "Discharge (CFS)", ylab = "Specific Conductivity (uS/cm)",
  main = paste0("Subsampled Daily Data\nSubsampled on the 15th of each month"),
  log = "x"
)
points(
  df$q[df$selection_type != "not_selected"],
  df$value[df$selection_type != "not_selected"],
  pch = 16, cex = 1.5,
  col = c(
    "routine" = "blue"
  )[df$selection_type[df$selection_type != "not_selected"]]
)
legend(
  "topright",
  legend = c("Not Selected", "Routine"),
  fill = c("gray", "blue")
)
The subsample_routine() function is a wrapper for the
base R function seq.Date(), and therefore does not rely on
randomization - meaning, routine subsampling is non-random and results
are reproducible.
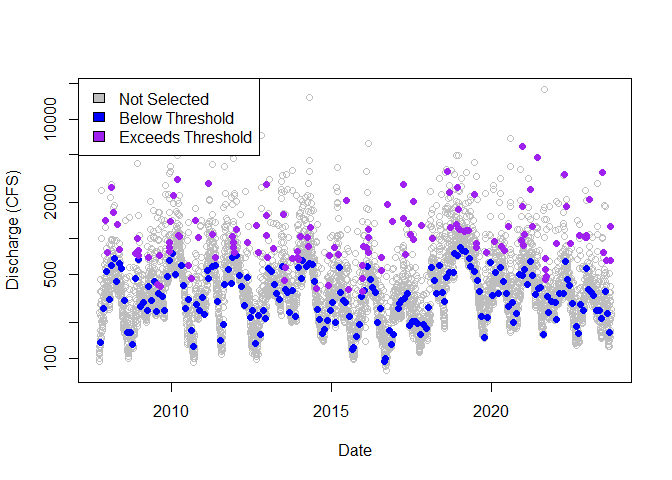
The subsample() function will perform stratified
subsampling to produce a smaller, representative data set a daily water
quality record. This function does use the base R sample()
function, therefore a seed parameter (default is 123) is
provided to ensure results are reproducible.
ss_sc <- subsample(
  dates = streamdat$date,
  values = streamdat$sc,
  thresh_ref = streamdat$q
)

not_selected <- ss_sc[ss_sc$selection_type == "not_selected", ]
blw_thresh <- ss_sc[ss_sc$selection_type == "below_threshold", ]
excd_thresh <- ss_sc[ss_sc$selection_type == "exceeds_threshold", ]

# Sampling across dates
plot(
  not_selected$date, not_selected$thresh_ref,
  col = "gray", log = "y",
  xlab = "Date", ylab = "Discharge (CFS)"
)
points(
  blw_thresh$date, blw_thresh$thresh_ref,
  col = "blue", pch = 16
)
points(
  excd_thresh$date, excd_thresh$thresh_ref,
  col = "purple", pch = 16
)
legend("topleft",
  c("Not Selected", "Below Threshold", "Exceeds Threshold"),
  fill = c("gray", "blue", "purple")
)
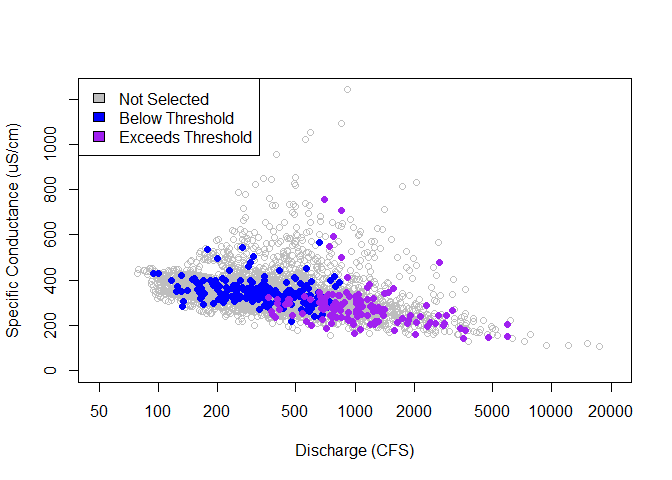
# Sampling across the threshold reference
plot(
  not_selected$thresh_ref, not_selected$value,
  log = "x", ylim = c(0, max(ss_sc$value, na.rm = TRUE)),
  xlim = c(50, 20000), col = "gray",
  xlab = "Discharge (CFS)", ylab = "Specific Conductance (uS/cm)",
)
points(
  blw_thresh$thresh_ref, blw_thresh$value,
  col = "blue", pch = 16
)
points(
  excd_thresh$thresh_ref, excd_thresh$value,
  col = "purple", pch = 16
)
legend("topleft",
  c("Not Selected", "Below Threshold", "Exceeds Threshold"),
  fill = c("gray", "blue", "purple")
)
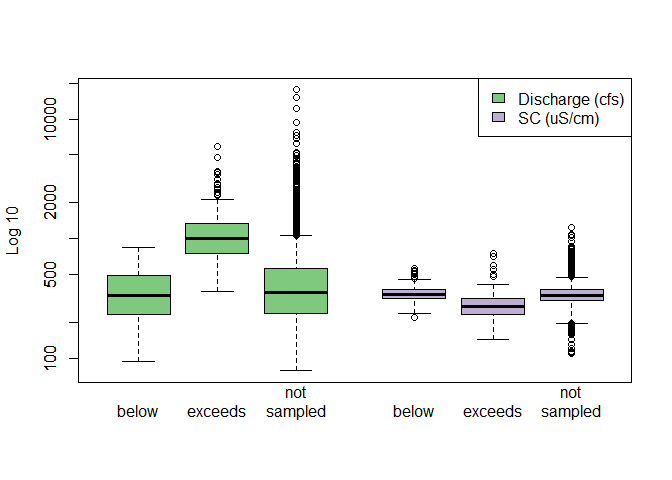
# Compare spread
ss_sc$q_lab <- "Discharge"
ss_sc$sc_lab <- "SC"
boxplot(
  thresh_ref ~ selection_type + q_lab, data = ss_sc,
  at = 1:3,
  xlim = c(0.5, 7.0),
  log = "y",
  col = "#7fc97f", ylab = "Log 10", xlab = "", xaxt = "n"
)
boxplot(
  value ~ selection_type + sc_lab, data = ss_sc,
  add = TRUE, at = 5:7 - 0.5, xaxt = "n",
  col = "#beaed4"
)
axis(
  1, at = c(1:3, 5:7 - 0.5),
  labels = rep(c("below", "exceeds", "not\nsampled"), 2),
  lwd = 0
)
legend(
  "topright",
  c("Discharge (cfs)", "SC (uS/cm)"),
  fill = c("#7fc97f", "#beaed4")
)
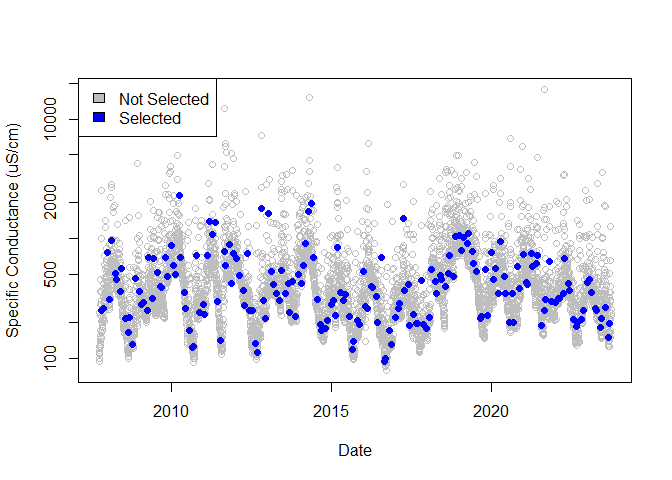
The default is to subsample for 1 observation that is below the
threshold for each month, and for 8 observations that are above the
threshold for each year, where the threshold is the 80th percentile of
each season (4 seasons starting in October). If the user desires
observations to be selected at random without stratifying the water
quality record, then threshold can be set to
1. A simple example:
rand_sc <- subsample(
  dates = streamdat$date,
  values = streamdat$sc,
  thresh_ref = streamdat$q,
  threshold = 1
)

not_selected <- rand_sc[rand_sc$selection_type == "not_selected", ]
blw_thresh <- rand_sc[rand_sc$selection_type == "below_threshold", ]

# Sampling across dates
plot(
  not_selected$date, not_selected$thresh_ref,
  col = "gray", log = "y",
  xlab = "Date", ylab = "Specific Conductance (uS/cm)"
)
points(
  blw_thresh$date, blw_thresh$thresh_ref,
  col = "blue", pch = 16
)
legend("topleft",
  c("Not Selected", "Selected"),
  fill = c("gray", "blue")
)
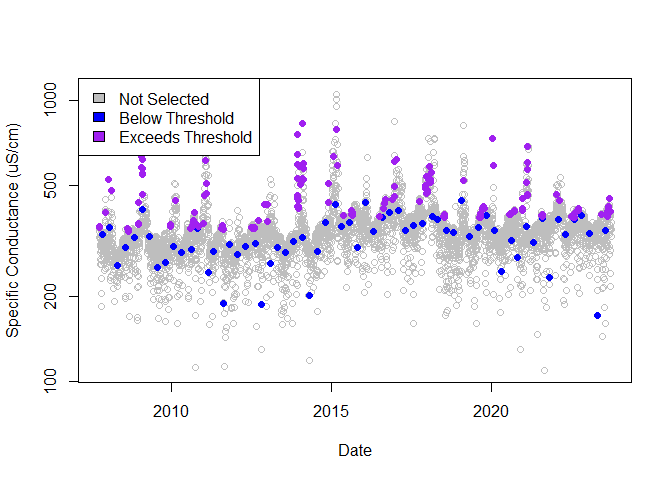
There are several ways to change the subsampling procedure. In the example below, SC will be used as the threshold reference instead of discharge; peaks, based on a 30-day sliding window, will be targeted for observations exceeding the 90th percentile; the year will be set to start in January with 3 seasons; and 1 observation below the threshold per quarter and 10 observations exceeding the threshold per year will be selected.
ss_peaks <- subsample(
  dates = streamdat$date,
  values = streamdat$sc, n_samples = 1, freq = "quarter",
  thresh_ref = streamdat$sc, threshold = 0.9, n_et_samples = 10,
  look_behind = 29, look_units = "days",
  season_start = 1, n_seasons = 3
)

ss_streamdat <- merge(streamdat, ss_peaks[, c("date", "selection_type")])
not_selected <- ss_streamdat[ss_streamdat$selection_type == "not_selected", ]
blw_thresh <- ss_streamdat[ss_streamdat$selection_type == "below_threshold", ]
excd_thresh <- ss_streamdat[ss_streamdat$selection_type == "exceeds_threshold", ]


# Sampling across dates
plot(
  not_selected$date, not_selected$sc,
  col = "gray", log = "y",
  xlab = "Date", ylab = "Specific Conductance (uS/cm)"
)
points(
  blw_thresh$date, blw_thresh$sc,
  col = "blue", pch = 16
)
points(
  excd_thresh$date, excd_thresh$sc,
  col = "purple", pch = 16
)
legend("topleft",
  c("Not Selected", "Below Threshold", "Exceeds Threshold"),
  fill = c("gray", "blue", "purple")
)
# Sampling across the threshold reference
plot(
  not_selected$q, not_selected$sc, col = "gray",
  log = "x", ylim = c(0, max(ss_sc$value, na.rm = TRUE)),
  xlab = "Discharge (CFS)", ylab = "Specific Conductance (uS/cm)"
)
points(
  blw_thresh$q, blw_thresh$sc,
  col = "blue", pch = 16
)
points(
  excd_thresh$q, excd_thresh$sc,
  col = "purple", pch = 16
)
legend("topleft",
  c("Not Selected", "Below Threshold", "Exceeds Threshold"),
  fill = c("gray", "blue", "purple")
)
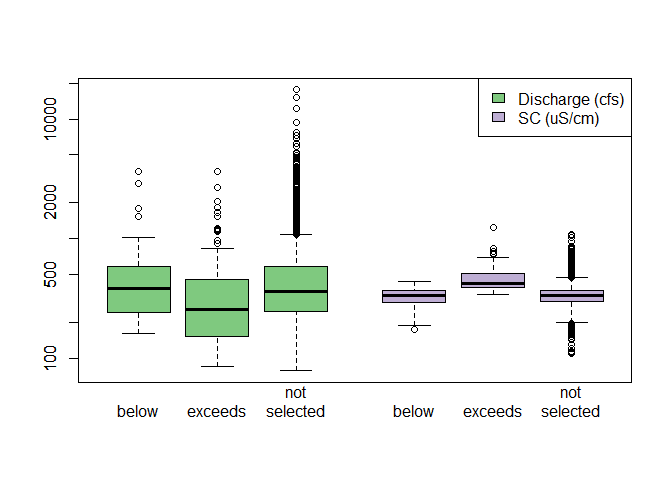
Changing the threshold reference, number of seasons, and the season start month alters how the data set is stratified.
# Compare spread
ss_streamdat$q_lab <- "Discharge"
ss_streamdat$sc_lab <- "SC"
boxplot(
  q ~ selection_type + q_lab, data = ss_streamdat,
  # at = 1:3 - 0.2,
  at = 1:3,
  # boxwex = 0.25,
  xlim = c(0.5, 7.0),
  log = "y",
  col = "#7fc97f", ylab = "", xlab = "", xaxt = "n"
  # names = c("below", "exceeds", "not\nsampled")
)
boxplot(
  sc ~ selection_type + sc_lab, data = ss_streamdat,
  add = TRUE, at = 5:7 - 0.5, xaxt = "n",
  col = "#beaed4"
  # names = c("below", "exceeds", "not\nsampled")
)
axis(
  1, at = c(1:3, 5:7 - 0.5),
  labels = rep(c("below", "exceeds", "not\nselected"), 2),
  lwd = 0
)
legend(
  "topright",
  c("Discharge (cfs)", "SC (uS/cm)"),
  fill = c("#7fc97f", "#beaed4")
)
Please consider reporting bugs and asking questions on the Issues page: https://github.com/Kyle-Hurley/streamsampler/issues