



The goal of ggarrow is to draw arrows in {ggplot2}. It is a {ggplot2} extension package that focusses on specialised geometry layers to expand the toolkit of arrows.
You can install ggarrow from CRAN
install.packages("ggarrow")You can install the development version of ggarrow from GitHub with:
# install.packages("devtools")
devtools::install_github("teunbrand/ggarrow")They’re made for pointing at things. The workhorse functionality is
in the geom_arrow() function that, unsurprisingly, draws
arrows.
library(ggarrow)
#> Loading required package: ggplot2

p <- ggplot(whirlpool(5), aes(x, y, colour = group)) +
  coord_equal() +
  guides(colour = "none")
p + geom_arrow()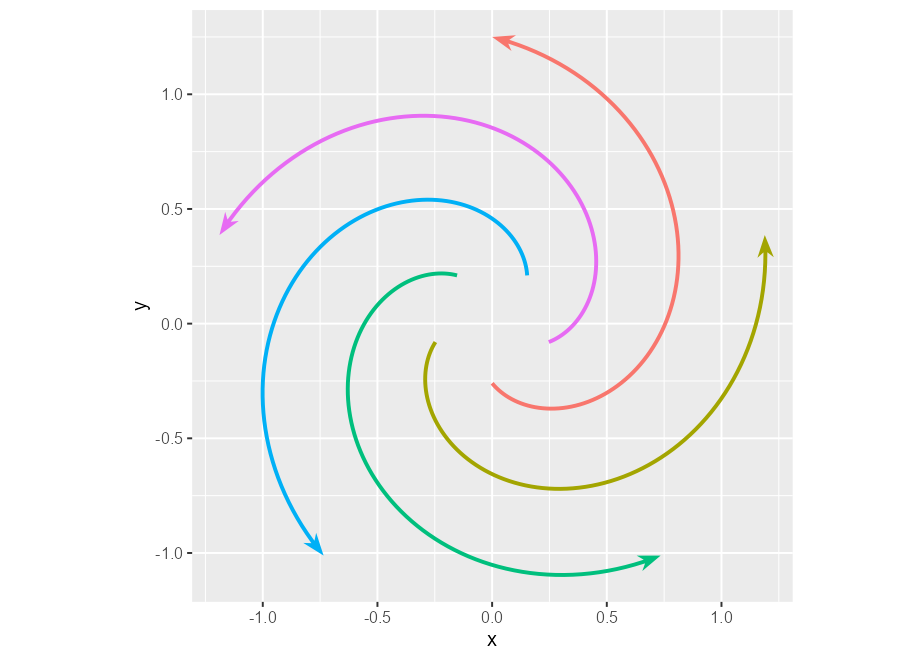
Arrows, in contrast to vanilla lines, can have variable widths.
p + geom_arrow(aes(linewidth = I(arc))) # Identity scale for linewidth
Besides varying linewidths, there is also an option to place arrows along the path. You could draw arbitrarily many of these, but I doubt that will look pretty.
p + geom_arrow(arrow_mid = "head_wings", mid_place = c(0.25, 0.5, 0.75))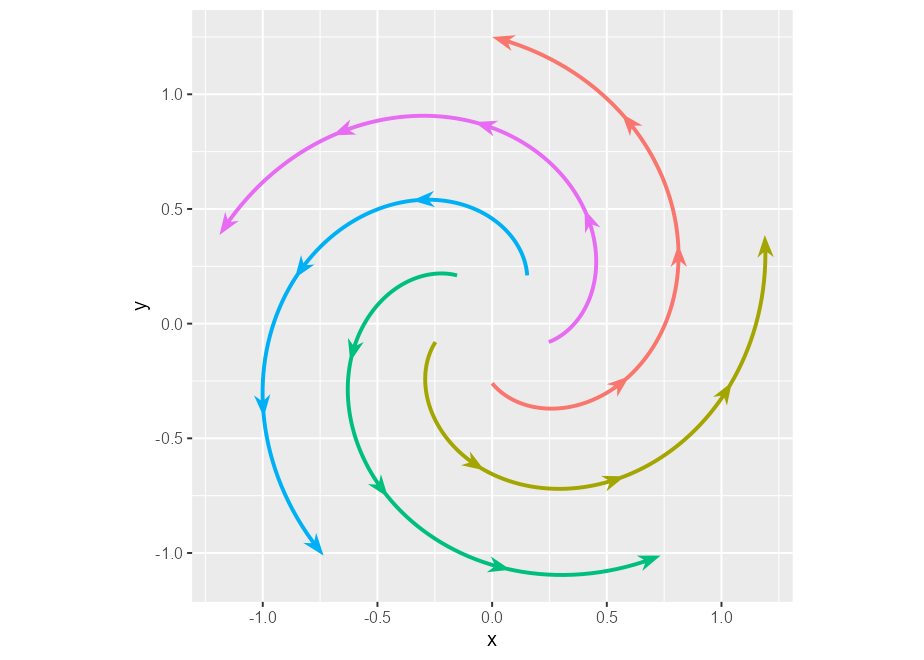
You can also tweak what the arrows should look like. The example below is a bit verbose, but gives an impression of the available options by combining different styles of arrow heads and what are termed ‘arrow fins’.
p + geom_arrow(aes(arrow_head = group, arrow_fins = group), linewidth = 2) +
  scale_arrow_head_discrete(values = list(
    "head_wings",
    arrow_head_wings(offset = 20, inset = 70),
    arrow_head_line(lineend = "parallel"),
    arrow_head_line(45, lineend = "round"),
    "head_minimal"
  ), guide = "none") +
  scale_arrow_fins_discrete(values = list(
    "fins_feather",
    arrow_fins_feather(indent = 0, outdent = 0, height = 1),
    "fins_line",
    arrow_fins_line(90),
    "fins_minimal"
  ), guide = "none")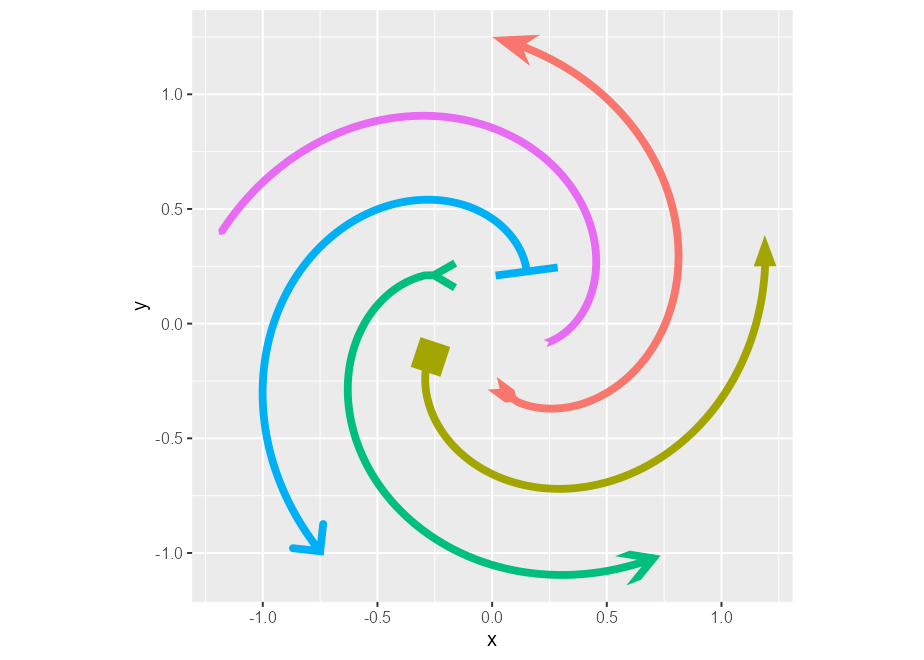
There are some other geoms that mimic bread-and-butter ggplot2
layers, such as geom_arrow_segment() and
geom_arrow_curve(), that add the same arrow functionality
on top of the geom_segment() and geom_curve()
layers.
Aside from these, there is also geom_arrow_chain(),
which has no equivalent in vanilla ggplot2. It adds arrows in between
points, and dodges the endpoints a bit so that they don’t seem to touch.
In the example below, we can see that we can dodge points of different
sizes.
t <- seq(0, 2 * pi, length.out = 11)
l <- rep(c(1, 0.4), length.out = 11)

df <- data.frame(
  x = cos(t) * l,
  y = sin(t) * l,
  size = l
)

ggplot(df, aes(x, y, size = size)) +
  geom_point(colour = 2) +
  geom_arrow_chain() +
  coord_equal()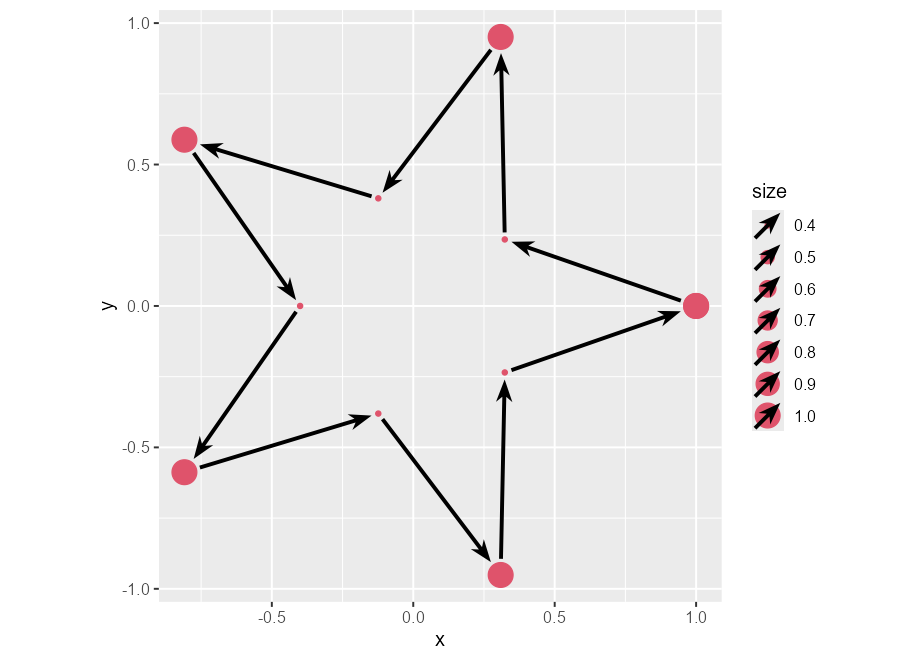
Because arrows are almost drop-in replacements for lines, I also
included element_arrow() as a theme element. With function,
you can set any line element in the theme to an arrow, with similar
customisation options as the layers.
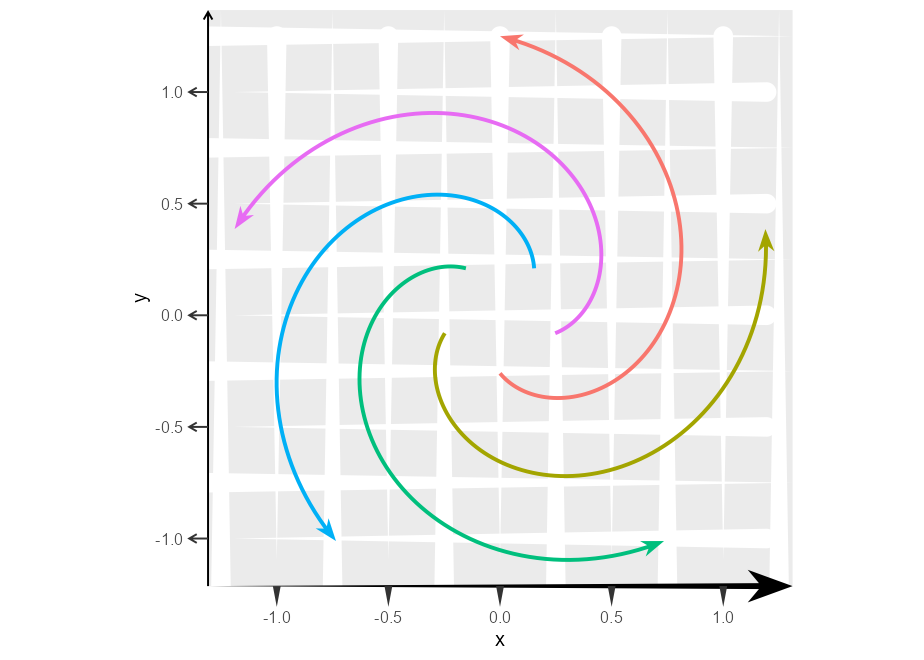
p + geom_arrow() +
  theme(
    axis.line.x = element_arrow(
      arrow_head = "head_wings", linewidth_head = 1.5, linewidth_fins = 0
    ),
    axis.line.y = element_arrow(arrow_head = "head_line"),
    axis.ticks.length = unit(0.4, "cm"),
    axis.ticks.x = element_arrow(linewidth_fins = 0, linewidth_head = 2),
    axis.ticks.y = element_arrow(arrow_fins = "head_line"),
    panel.grid.major = element_arrow(
      linewidth_head = 5, linewidth_fins = 0,
      resect_head = 5, resect_fins = 5, lineend = "round"
    ),
    panel.grid.minor = element_arrow(
      linewidth_head = 0, linewidth_fins = 5
    )
  )
The current limitation is that variable width paths don’t lend themselves well to jagged paths with short segments. This is because I had to implement linejoins for variable width paths and I barely have high-school level understanding of trigonometry. Consequently, the linejoins look bad with short jagged segments.
ggplot(economics, aes(date, unemploy)) +
  geom_arrow(aes(linewidth = date))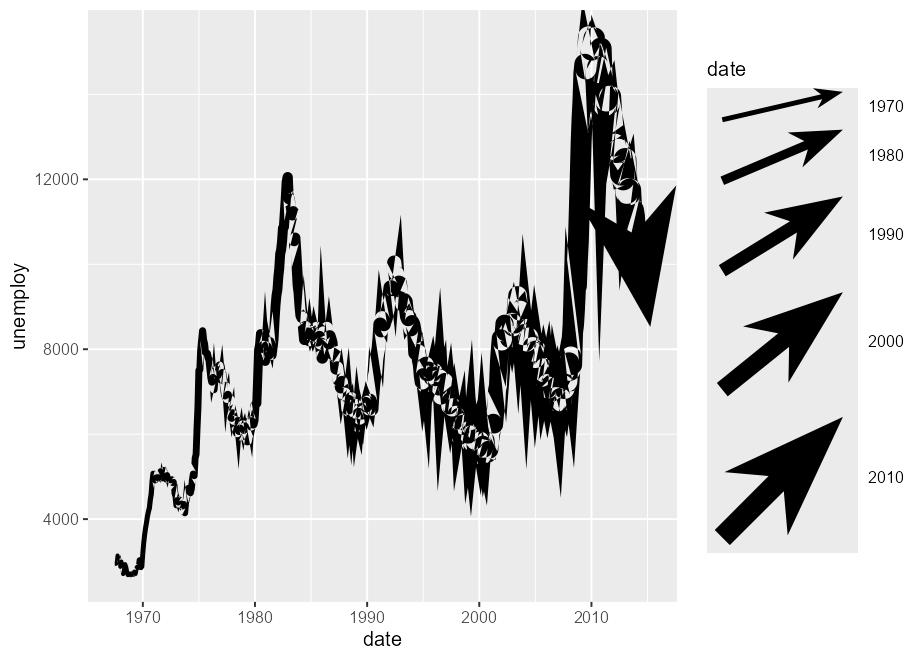
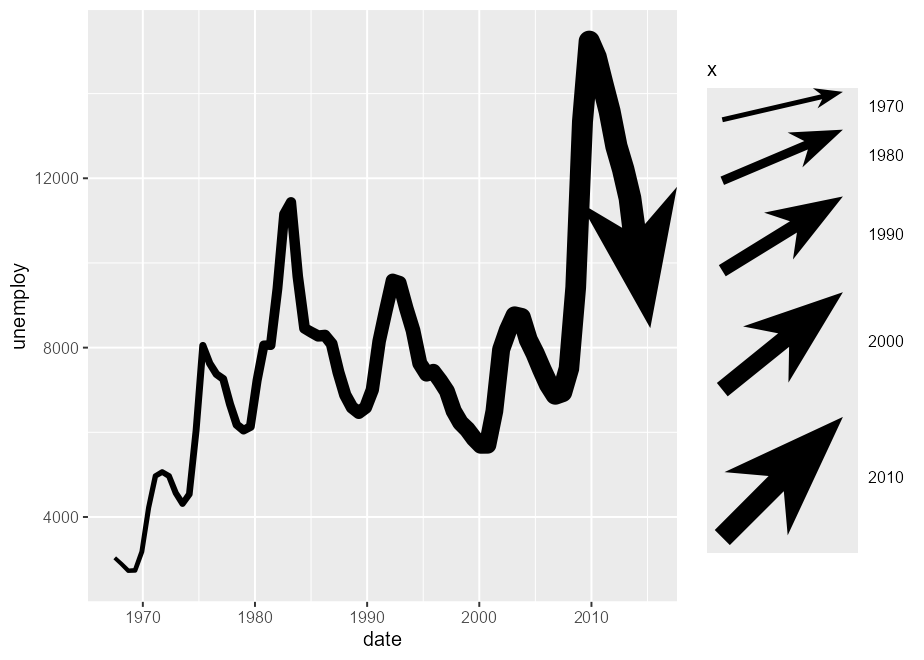
The best advice I can give for the jagged linejoins is to smooth the data beforehand.
ggplot(economics, aes(date, unemploy)) +
  geom_arrow(
    stat = "smooth", formula = y ~ x, method = "loess", span = 0.05,
    aes(linewidth = after_stat(x))
  )
A second limitation is that you cannot use variable widths with different linetypes.
The {ggarrow} package largely takes on the same dependencies as {ggplot2} to keep it on the lightweight side. However, this package wouldn’t work at all without the {polyclip} dependency, which is the only one outside {ggplot2}’s imports.
Of course, the {grid} package, on which {ggplot2} is build upon,
offers some options for arrows. The {arrowheadr} package
provides some great extensions for arrowheads. The {vwlines} package
that handles variable widths lines much more graciously than this
package. Both the {gggenes}
and {gggenomes}
packages use arrows in a domain-specific context. For vector field
visualisation, there is the {ggquiver}
package. The {ggarchery} package
also provides extended options for the geom_segment()
parametrisation of lines.