![]()
![]()
![]()
CourseKata Statistics and Data Science, is an innovative interactive online textbook for teaching introductory statistics and data science in colleges, universities, and high schools. Part of CourseKata’s Better Book Project, we are leveraging research and student data to guide continuous improvement of online learning resources. The coursekata package is designed to make it easy to install and load the packages, functions, and data used in the book and supplementary materials.
Learn more about CourseKata and its services and materials at CourseKata.org.
This package makes it easy to install and load all packages and functions used in CourseKata courses. It additionally provides a handful of helper functions and augments some generic functions to provide cohesion between the network of packages. This package was inspired by the tidyverse meta-package.
install.packages("coursekata")After installing the core packages, you might want to install the supplementary data packages used in the course. These are not required for the package to work, but they are used in the course materials. You can install them with the following command:
coursekata::coursekata_install()If you don’t install these packages, you will be prompted to install
them each time you load the package. If you want to disable that prompt,
you can set options(coursekata.quickstart = TRUE).
To get a bug fix or to use a feature from the development version,
you can install the development version of coursekata from
GitHub.
# install.packages("pak")
pak::pak("coursekata/coursekata-r")library(coursekata) will load the following core
packages in addition to the functions and
theme included in the coursekata package:
library(coursekata)b0(), b1(), PRE(),
fVal())print.lm() which prints the fitted
equation as wellIn addition to useful functions, a great deal of data sets are used by instructors who teach the course. This package installs these:
coursekata.quickstart: Each time the package is
loaded (e.g. via library(coursekata)) a check is run to
ensure that all the dependencies are installed and reasonably
up-to-date. If they are not, you will be prompted to install missing
packages. This can be disabled by setting
options(coursekata.quickstart = TRUE).
coursekata.quiet: By default, the package will show
all startup messages from the dependent packages. To quiet these (like
in the output above), you can set
options(coursekata.quiet = TRUE)
This package also comes with a variety of functions useful for
teaching statistics and data science, and it has an automatically set
ggplot2 theme complete with colorblind-friendly palettes
and other improvements to aid perception and clarity of plots.
Extracting an estimate is as easy as passing a fitted linear model to one of the extraction functions:
fit <- lm(mpg ~ hp, data = mtcars)

# the estimate for β₀, the intercept
b0(fit)
#> [1] 30.09886

# the estimate for β₁, the slope
b1(fit)
#> [1] -0.06822828

# all the estimates
b(fit)
#> $b_0
#> [1] 30.09886
#>
#> $b_hp
#> [1] -0.06822828

# the proportional reduction in error
pre(fit)
#> [1] 0.6024373

# Fisher's F value
f(fit)
#> [1] 45.4598

# the p-value for the F test
p(fit)
#> [1] 1.787835e-07
The estimate extraction functions help to simplify the ability to create bootstrapped sampling distributions of those estimates. Here is an example of bootstrapping the slope:
# use mosaic package to repetitively resample to bootstrap a distribution
samp_dist_of_b1 <- do(1000) * b1(lm(mpg ~ hp, data = resample(mtcars)))

# plot the bootstrapped estimates
gf_histogram(~ samp_dist_of_b1$b1)
#> `stat_bin()` using `bins = 30`. Pick better value `binwidth`.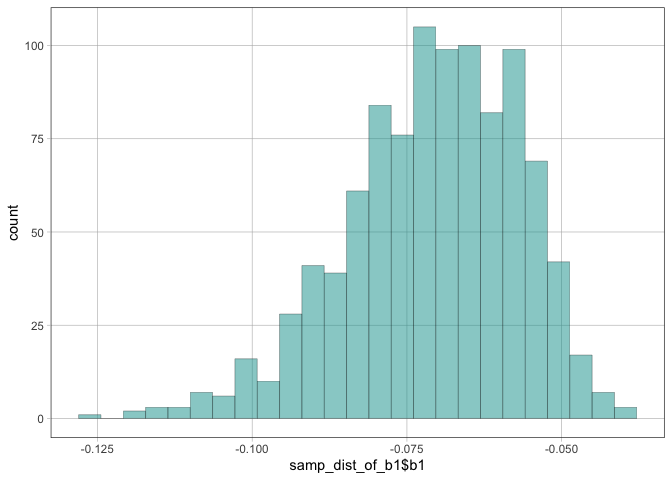
Other estimates and terms can be bootstrapped using the same technique, but you will need to calculate the values yourself. Here’s an example of doing that for a term that doesn’t have a dedicated extraction function:
samp_dist_of_hp <- do(1000) * {
  # create a new model from the resampled data
  model <- lm(mpg ~ disp * hp, data = resample(mtcars))

  # extract the desired estimate, here the coefficient for hp
  coef(model)[["hp"]]
}

# plot the bootstrapped estimates
gf_histogram(~ samp_dist_of_hp$result)
#> `stat_bin()` using `bins = 30`. Pick better value `binwidth`.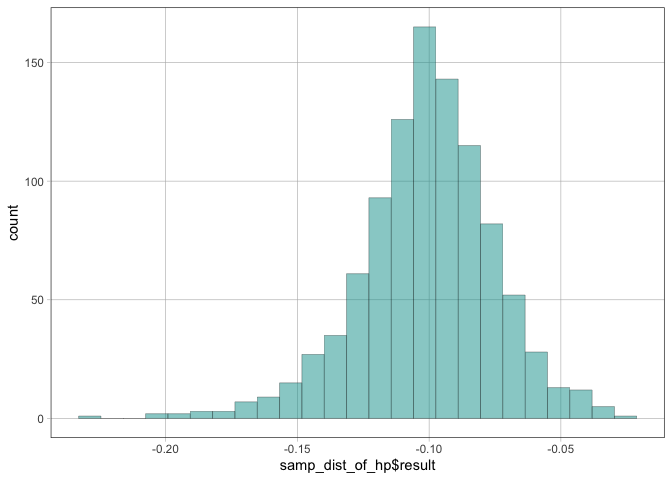
When teaching about hypothesis testing, F, and
p-value, it is useful to mark different portions of a
distribution as inside or outside the critical zone.
middle(), upper(), and lower()
each take a distribution of values and return whether the value was in,
e.g. the middle 95% of the distribution. Use this with a plotting
function to shade in those areas:
# shade in the middle 80% of the Thumb distribution
gf_histogram(~Thumb, data = Fingers, fill = ~ middle(Thumb, .80))
#> `stat_bin()` using `bins = 30`. Pick better value `binwidth`.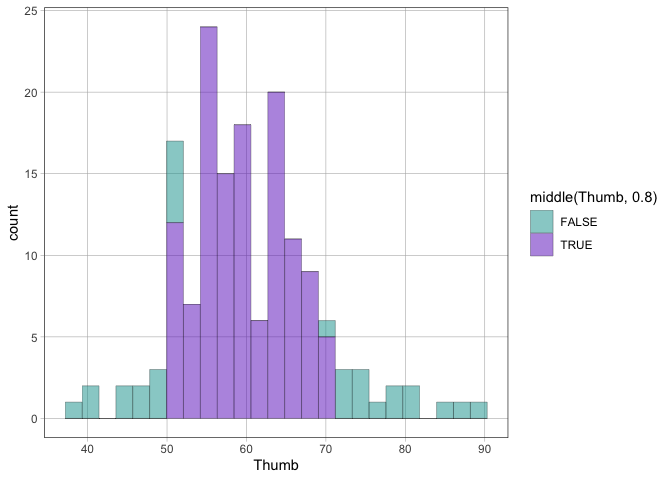
The ggplot2 theme is loaded by default but can be
toggled on and off via coursekata_load_theme() and
coursekata_unload_theme(). The actual plot theme and scale
components are also provided for advanced users as
theme_coursekata() and
scale_discrete_coursekata() (viridis is used
for continuous color scales).
If you see an issue, problem, or improvement that you think we should know about, or you think would fit with this package, please let us know on our issues page. Alternatively, if you are up for a little coding of your own, submit a pull request:
git checkout -b my-new-featuregit commit -am 'Add some feature'git push origin my-new-feature