alkahest


Overview
alkahest is a lightweight, dependency-free toolbox
for pre-processing XY data from experimental methods (i.e. any signal
that can be measured along a continuous variable). It provides methods
for baseline estimation and correction, smoothing, normalization,
integration and peaks detection.
- Baseline estimation methods: Linear, Polynomial (Lieber and
Mahadevan-Jansen 2003), Asymmetric Least Squares (Eilers and Boelens
2005), Rolling Ball (Kneen and Annegarn 1996), Rubberband, SNIP (Morháč
et al. 1997; Morháč and Matoušek 2008; Ryan et al. 1988), 4S Peak
Filling (Liland 2015).
- Smoothing methods: Rectangular, Triangular, Loess, Savitzky-Golay
Filter (Gorry 1990; Savitzky and Golay 1964), Whittaker (Eilers 2003),
Penalized Likelihood (De Rooi et al. 2014)
To cite alkahest in publications use:
Frerebeau N (2025). alkahest: Pre-Processing XY Data from
Experimental Methods. Université Bordeaux Montaigne, Pessac,
France. doi:10.5281/zenodo.7081524 https://doi.org/10.5281/zenodo.7081524, R package
version 1.3.0, https://packages.tesselle.org/alkahest/.
This package is a part of the tesselle project https://www.tesselle.org.
Installation
You can install the released version of alkahest
from CRAN with:
install.packages("alkahest")
And the development version from Codeberg with:
# install.packages("remotes")
remotes::install_git("https://codeberg.org/tesselle/alkahest")
Usage
## Load the package
library(alkahest)
alkahest expects the input data to be in the
simplest form (a two-column matrix or data frame, a two-element list or
two numeric vectors).
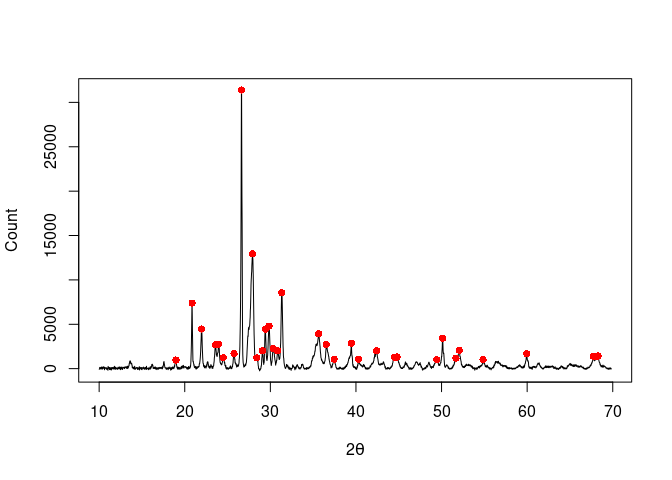
## X-ray diffraction
data("XRD")

## 4S Peak Filling baseline
baseline <- baseline_peakfilling(XRD, n = 10, m = 5, by = 10, sparse = TRUE)

plot(XRD, type = "l", xlab = expression(2*theta), ylab = "Count")
lines(baseline, type = "l", col = "red")

## Correct baseline
XRD <- signal_drift(XRD, lag = baseline, subtract = TRUE)

## Find peaks
peaks <- peaks_find(XRD, SNR = 3, m = 11)

plot(XRD, type = "l", xlab = expression(2*theta), ylab = "Count")
lines(peaks, type = "p", pch = 16, col = "red")
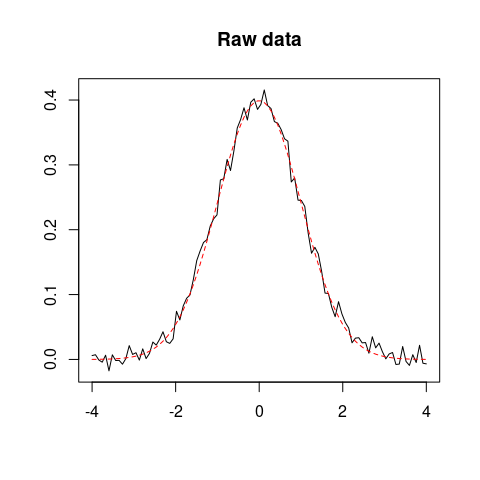
## Simulate data
set.seed(12345)
x <- seq(-4, 4, length = 100)
y <- dnorm(x)
z <- y + rnorm(100, mean = 0, sd = 0.01) # Add some noise
## Plot raw data
plot(x, z, type = "l", xlab = "", ylab = "", main = "Raw data")
lines(x, y, type = "l", lty = 2, col = "red")
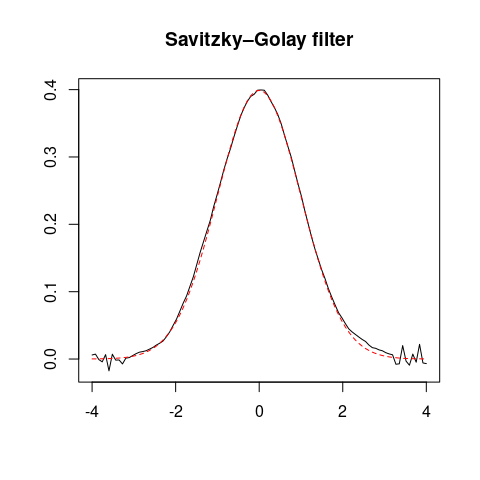
## Savitzky–Golay filter
smooth <- smooth_savitzky(x, z, m = 21, p = 2)
plot(smooth, type = "l", xlab = "", ylab = "", main = "Savitzky–Golay filter")
lines(x, y, type = "l", lty = 2, col = "red")
Contributing
Please note that the alkahest project is released
with a Contributor Code
of Conduct. By contributing to this project, you agree to abide by
its terms.
References
Barnes, R. J., M. S. Dhanoa, and Susan J. Lister. 1989. “Standard Normal
Variate Transformation and De-Trending of Near-Infrared Diffuse
Reflectance Spectra.”
Applied Spectroscopy 43 (5): 772–77.
https://doi.org/10.1366/0003702894202201.
De Rooi, Johan J., Niek M. Van Der Pers, Ruud W. A. Hendrikx, Rob
Delhez, Amarante J. Böttger, and Paul H. C. Eilers. 2014. “Smoothing of
X-ray Diffraction Data and
K α
2 Elimination Using Penalized Likelihood and the Composite
Link Model.”
Journal of Applied Crystallography 47 (3): 852–60.
https://doi.org/10.1107/S1600576714005809.
Eilers, Paul H. C. 2003. “A Perfect Smoother.”
Analytical
Chemistry 75 (14): 3631–36.
https://doi.org/10.1021/ac034173t.
Eilers, Paul H. C., and Hans F. M. Boelens. 2005. “Baseline Correction
with Asymmetric Least Squares Smoothing.” October 21, 2005.
Gorry, Peter A. 1990. “General Least-Squares Smoothing and
Differentiation by the Convolution (Savitzky-Golay) Method.”
Analytical Chemistry 62 (6): 570–73.
https://doi.org/10.1021/ac00205a007.
Kneen, M. A., and H. J. Annegarn. 1996. “Algorithm for Fitting XRF, SEM
and
PIXE X-ray Spectra Backgrounds.”
Nuclear Instruments and Methods in Physics Research Section B: Beam
Interactions with Materials and Atoms 109–110 (April): 209–13.
https://doi.org/10.1016/0168-583X(95)00908-6.
Lieber, Chad A., and Anita Mahadevan-Jansen. 2003. “Automated Method for
Subtraction of Fluorescence from Biological Raman Spectra.”
Applied
Spectroscopy 57 (11): 1363–67.
https://doi.org/10.1366/000370203322554518.
Liland, Kristian Hovde. 2015. “4S Peak Filling – Baseline Estimation by
Iterative Mean Suppression.”
MethodsX 2: 135–40.
https://doi.org/10.1016/j.mex.2015.02.009.
Morháč, Miroslav, Ján Kliman, Vladislav Matoušek, Martin Veselský, and
Ivan Turzo. 1997. “Background Elimination Methods for Multidimensional
Coincidence γ-Ray Spectra.”
Nuclear Instruments and Methods in
Physics Research Section A: Accelerators, Spectrometers, Detectors and
Associated Equipment 401 (1): 113–32.
https://doi.org/10.1016/S0168-9002(97)01023-1.
Morháč, Miroslav, and Vladislav Matoušek. 2008. “Peak Clipping
Algorithms for Background Estimation in Spectroscopic Data.”
Applied
Spectroscopy 62 (1): 91–106.
https://doi.org/10.1366/000370208783412762.
Ryan, C. G., E. Clayton, W. L. Griffin, S. H. Sie, and D. R. Cousens.
1988. “SNIP, a Statistics-Sensitive Background Treatment for the
Quantitative Analysis of PIXE Spectra in Geoscience Applications.”
Nuclear Instruments and Methods in Physics Research Section B: Beam
Interactions with Materials and Atoms 34 (3): 396–402.
https://doi.org/10.1016/0168-583X(88)90063-8.
Savitzky, Abraham., and M. J. E. Golay. 1964. “Smoothing and
Differentiation of Data by Simplified Least Squares Procedures.”
Analytical Chemistry 36 (8): 1627–39.
https://doi.org/10.1021/ac60214a047.